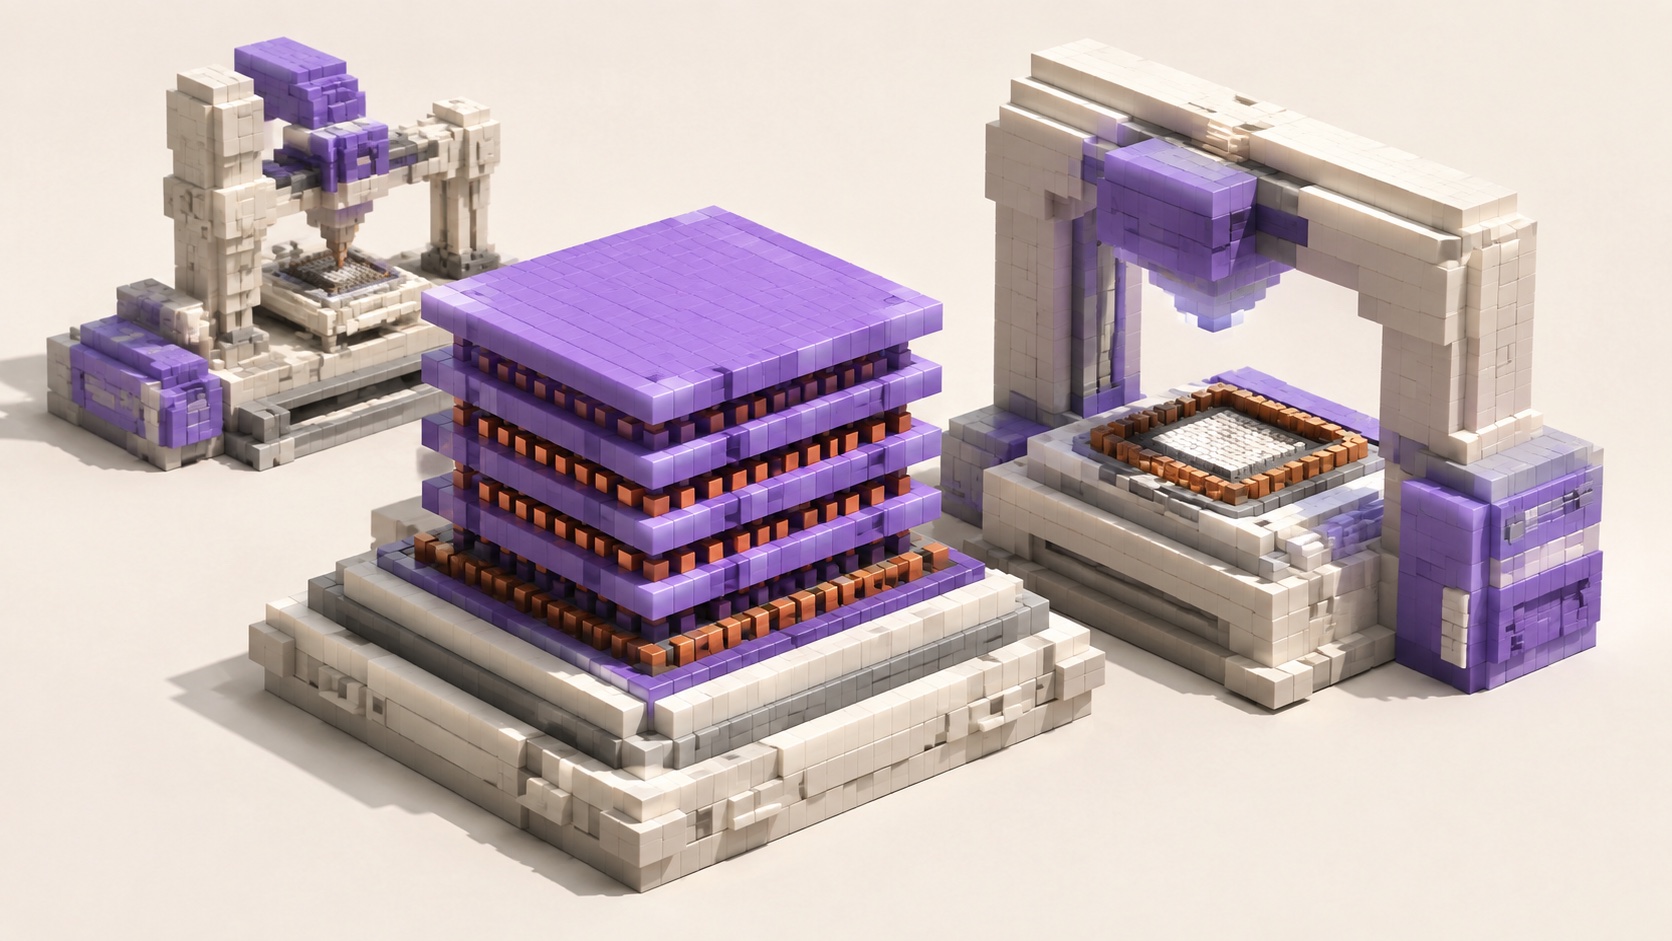
Micron's fiscal third-quarter announcement says HBM4 is shipping in volume for its lead customer's platform, with HBM4E volume production expected in calendar 2027. SK hynix has also described HBM4 delivery and expansion, alongside 12-layer HBM4E samples. Component commercialization is advancing, while complete AI-system delivery remains a separate outcome. [1][2][3]
The investor's next questions are qualified volume, profit per unit and the cash required to expand. Better memory can improve accelerator economics. Contract pricing, manufacturing yields and customer bargaining power determine how much of that value reaches memory shareholders.
In this article7 sections
Samples, qualified products and billable shipments differ
Samples support evaluation and configuration decisions. Volume production provides repeatable output. Revenue recognition still follows delivery, acceptance and contract terms. A product milestone cannot collapse these stages into one outcome.
Micron distinguishes volume shipments for its lead platform from qualification samples delivered to multiple end customers. That shows significant progress while leaving customers at different stages. One supplier's announcement does not establish deployment across every HBM4 platform. [1]
HBM4E is the next-generation roadmap. A 2027 production expectation and 12-layer samples do not guarantee simultaneous adoption of identical configurations. Performance, power, availability and price influence qualification. Current sales can coexist with substantial next-generation development spending.
Group memory profit also includes other products. HBM growth cannot explain every gross-margin movement without segment evidence. Conventional DRAM, NAND, costs and inventories can contribute, so attribution must remain proportionate.
Yield determines cost per saleable component
Material, processing, stacking, testing and packaging losses spread cost across fewer qualified products. Full stage-by-stage yields are not disclosed, preventing precise unit-cost forecasts, but the sensitivity can be illustrated.
| Illustrative production case | Cost per qualified item | Profit at price 1.50 |
|---|---|---|
| Cost 100; 80 qualified items | 1.250 | 0.250 |
| Cost 100; 90 qualified items | 1.111 | 0.389 |
Assume 100 units of production cost yield 80 qualified items: cost is 1.25 each. At 90 items from the same cost, it is about 1.111, an 11.1% decline. This simplified example excludes stage-specific losses and incremental processing and is not an HBM manufacturing estimate.
At a selling price of 1.50, unit gross profit rises from 0.25 to about 0.389. Lower realized prices could transfer part of the improvement to customers. Neither shipment growth nor price alone establishes the profit effect.
More layers and complex packaging can increase capacity and value while adding process and testing burdens. Layer count cannot be converted directly into revenue growth or lower unit cost. The premium needs support from system-level usefulness.
Available memory still needs a complete platform
Improved supply removes one constraint. Logic bases, advanced packaging, substrates, power, cooling and software validation must align before a server performs useful work. Delays elsewhere can leave otherwise ready components in inventory.
The memory supplier's exposure depends on order terms. Continued deliveries can preserve near-term revenue while raising customer inventory and affecting later purchases. Flexible delivery schedules can transmit delay immediately. These are different pathways.
Cloud operators also need facility power, cooling and network acceptance. Equipment arriving at a campus does not establish customer billing. Supplier profit, integration revenue and cloud cash generation can move in different quarters.
Track qualified memory shipments, platform configurations and delivery, then installation and paid service separately. Healthy upstream production cannot establish high utilization for every downstream asset.
Long contracts improve visibility without eliminating the cycle
Expansion requires research and equipment before receipts. Contract value depends on volume and price protection, adjustment rights, prepayments and remedies. A headline duration or total alone cannot justify the return on invested capital.
For illustration, $1 billion of equipment followed by $200 million of annual operating cash has a simple five-year payback before tax, time value and replacement. At $125 million it takes eight years. Actual returns also require maintenance, upgrades and residual values.
Fast product change raises questions about line flexibility, additional equipment and stranded specialized assets. Accounting depreciation allocates cost; it does not guarantee an equal period of economic competitiveness.
Technical barriers and qualification can constrain supply and support pricing for reliable manufacturers. Historic cyclicality does not prove inevitable oversupply, but current scarcity does not justify extending today's margins indefinitely. Contract quality and substitutability shape the cycle.
Better bandwidth can reduce costs and expand activity
If a workload is limited by memory capacity or bandwidth, improvements may reduce waiting and raise throughput. Other bottlenecks can limit the gain. Peak-bandwidth multiples should not be treated as application-speed multiples.
Customers may need fewer systems for the same work, or expand work as unit costs fall. Memory demand depends on content per system, system volume and workloads. The direction cannot be inferred from efficiency alone.
An illustrative 20% increase in system units and 15% increase in memory value per unit produces 38% content-value growth. If value per system instead falls 10%, the same unit growth produces only 8%. This separates volume, configuration and price without forecasting a supplier.
Customers ultimately evaluate total task cost. Memory pricing power depends on contribution to that cost, alternative suppliers and demand at lower prices. Technical leadership reaches profit through commercial contracts and competition.
After recognition, ask where capital remains tied up
Materials, processing and work in progress require funding before shipment. Better yields can reduce unit costs while longer production cycles raise working capital. Slow acceptance or collection can leave more cash in inventory or receivables. Profit can temporarily grow faster than operating cash.
Customer advances and purchase protection can reduce that pressure, while retaining future delivery obligations. Their value depends on permitted use and successful fulfillment. Advances, future orders and current revenue cannot be added as separate commercial volume.
Transition inventory also differs in flexibility. Materials usable across customers may be less exposed than specialized old configurations, without permitting an unsupported recovery estimate. Customers moving to a new generation before old stock clears can trigger impairments even when industry demand grows.
Cash returns and per-share returns require separate attention. Equity-funded expansion can grow total profit while diluting ownership. Debt limits immediate dilution but adds fixed payments. Either funding source must be matched to incremental project cash.
Reserving production can be sensible in scarcity and restrictive when demand disappoints. Assess whether customer and supplier commitments match by product, quantity and duration, rather than endorsing every new factory because current margins are strong.
Value across cycles requires competitive products, reliable manufacturing, customers and disciplined investment timing. HBM4 production makes product progress more visible. Contracts and successive financial periods must establish the rest.
Compare delivery quality with cash returns
Broader qualified configurations, repeat orders, lower manufacturing costs and sustained cash after capital expenditure would strengthen the case. More samples or peak specifications alone would not establish those financial outcomes.
Rising customer inventory, repeated delays, price concessions outpacing cost reductions or expansion continually exceeding cash generation would weaken it. Profit can move across the chain as bottlenecks change.
HBM4 volume production is a commercial starting point. Durable returns require qualified shipments becoming gross profit, that profit covering expansion and replacement, and customers' system and cloud businesses operating on workable cash schedules.
Sources
This website is for information and research only and does not constitute investment advice.