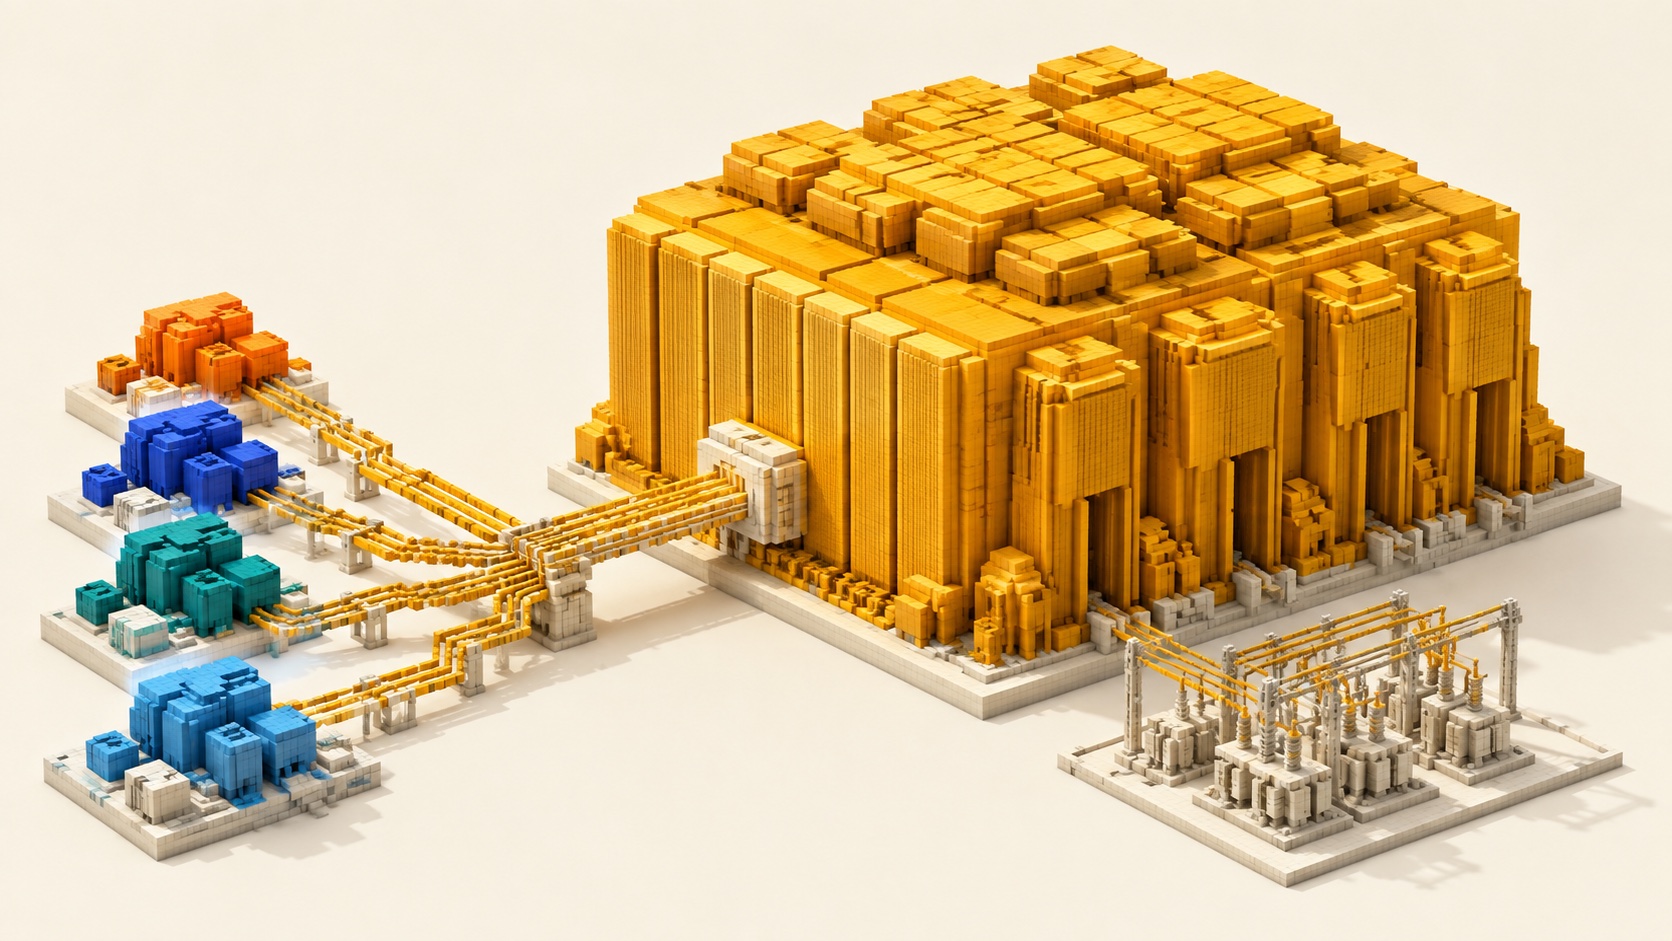
$725 billion makes a powerful headline. It also hides the most important lag in the AI buildout. Silicon entering a server rack still needs a campus, power, networking and commissioning. Assets already recorded as capital spending may remain months away from sellable cloud capacity.
Each company reveals a different point in that pipeline. Microsoft splits short- and long-lived assets. Alphabet carries a vast stock of assets not yet in service. Meta's guide mixes component inflation with future capacity. Amazon shows the immediate pressure on free cash flow. The question connecting all four is simple: the money has left; how far has the capacity traveled?
One buildout, four different clocks
| Company | Latest reported quarter | 2026 frame | Definition | Physical signal |
|---|---|---|---|---|
| Microsoft | $41.0BFY2026 Q4 | ≈ $175Breclassified 2026 view | Roughly two-thirds CPUs and GPUs; lease classification lowers the reported frame | About 1GW added; Azure grew 43% and supply remains constrained |
| Alphabet | $44.9B2026 Q2 | $195–205Braised full-year guide | Cash purchases of property and equipment, primarily technical infrastructure | Google Cloud revenue +82%; backlog reached $514B |
| Meta | $31.08B2026 Q2 | $130–145Bnarrowed full-year guide | Includes principal payments on finance leases | Capacity plans maximize 2026–27 supply and lay foundations for 2028+ |
| Amazon | ≈ $53.1B2026 Q2 cash CapEx | ≈ $220Bmanagement's full-company view | Company-wide spending; not a standalone AWS disclosure | AWS revenue +37%; management still expects capacity constraints in 2026–27 |
Data cut-off: August 1, 2026. Microsoft's revised $175 billion presentation reflects data-center lease classification; management said underlying investment expectations are unchanged. Amazon's figures are full-company cash CapEx, not standalone AWS or AI data-center disclosures.
Accounting records the spend before physics delivers the revenue
Orders hit CapEx first
GPUs, CPUs, memory and networking equipment create the earliest financial signal. Component inflation can lift spending even when unit growth is lower.
Construction creates a delivery queue
Alphabet will use third-party capacity as a bridge in Q3, while Meta is maximizing 2026–27 capacity and preparing for 2028+. Both disclosures show that the delivery queue remains a live constraint.
Power and utilization set the return
Capacity monetizes after grid connection, commissioning and customer allocation. Demand absorption, depreciation and energy costs determine the return.
The lag explains why supplier revenue arrives at different times. Equipment vendors see orders first. Electrical and construction work follows milestones. Data-center operators wait for delivery and billing. Cloud platforms face the final utilization test.
Azure accelerates as next-quarter CapEx moves above $50 billion
GPUs and CPUs enter the asset base—and depreciation cycle—quickly.
Large data-center sites can support monetization for fifteen years and beyond.
The latest quarter was primarily large data-center sites.
Microsoft reported $90.0 billion of FY2026 Q4 revenue, up 18%, while Azure and other cloud services grew 43%. It guides Azure to roughly 45% constant-currency growth in Q1. Quarterly CapEx was $41.0 billion, with roughly two-thirds directed to short-lived CPUs and GPUs; finance leases were $5.6 billion and cash paid for property and equipment was $35.8 billion. Q1 CapEx is expected above $50 billion, and management expects FY27 CapEx to grow year over year. Microsoft FY2026 Q4 results
The new calendar-2026 presentation of roughly $175 billion is below the prior $190 billion framing. Management said the difference mainly reflects more future data-center leases shifting from finance to operating leases after extending the estimated useful life of data centers and offices from 15 to 25 years. Underlying investment expectations were described as unchanged.
Delivery improved alongside spending. Microsoft added 31 data centers and about one gigawatt of capacity in the quarter. GPU dock-to-live time in its largest regions fell nearly 50% during the fiscal year, and the company remains on track to roughly double overall capacity in two years. In Q&A, management said demand still exceeds available supply and that CPU, GPU and deployment-efficiency gains can be monetized within the quarter. Microsoft FY2026 Q4 call
Transmission: Azure acceleration is now visibly tied to usable capacity, fleet efficiency and deployment speed. The next checks are the quarter above $50 billion, the short-lived asset mix, the lease-definition shift and how quickly the added capacity is absorbed.
Cloud growth is converting; the capacity gap remains
Alphabet spent $44.9 billion on property and equipment in Q2. Operating cash flow was $39.1 billion and free cash flow was negative $5.9 billion. Google Cloud revenue reached $24.8 billion, up 82%, and operating income rose to $8.8 billion. The figures show that new capacity is converting into growth, but not yet fast enough to reduce investment intensity. Alphabet Q2 2026 results
Management raised the 2026 CapEx guide to $195–205 billion from $180–190 billion. On the public call transcript, it said Cloud backlog reached $514 billion, up about $50 billion sequentially, with more than half expected to be recognized over the next 24 months. Alphabet will use third-party capacity in Q3 as a bridge and expects modest margin pressure from that choice. Alphabet Q2 public call transcript
Transmission: backlog supports the demand case, while third-party capacity shows the supply gap has not closed. The next test is whether owned capacity comes online fast enough to preserve Cloud margins as revenue scales.
The buildout now preserves multiple monetization paths
Meta reported Q2 revenue of $60.8 billion, up 28%, and CapEx of $31.08 billion including finance-lease principal payments. Free cash flow was $784 million. The company narrowed its 2026 CapEx range to $130–145 billion. Meta Q2 2026 results
In the official transcript, management said it was maximizing capacity for 2026 and 2027 while laying foundations for 2028 and beyond. It also discussed APIs, enterprise agents and selling compute as possible monetization paths. These are strategic options, not reported revenue, and should not be counted before customers and economics are disclosed. Meta Q2 official transcript
Transmission: Meta is building for both internal models and optional external demand. The proof will come from delivered capacity, product revenue and whether depreciation grows in line with monetization.
AWS accelerated as free cash flow crossed below zero
AWS Q2 revenue reached $42.2 billion, up 37%, with operating income of $16.6 billion. Trailing-twelve-month operating cash flow rose 33% to $161.4 billion, while net property and equipment purchases reached $169.0 billion and free cash flow fell to negative $7.6 billion, primarily because of AI investment. Amazon Q2 2026 results
Public call reporting says management raised its 2026 full-company cash CapEx view to about $220 billion from roughly $200 billion, mainly because of memory costs. Management also said capacity would remain insufficient through 2026 and likely 2027. That figure covers the whole company and must not be presented as standalone AWS spending. Amazon Q2 public call reporting
Transmission: AWS acceleration confirms demand absorption, but negative free cash flow shows the cost of staying ahead of that demand. Capacity delivery, memory costs and the path back to cash generation are now the combined test.
Six gates between purchase order and cloud revenue
- 01Silicon and server orders
GPUs, CPUs, TPUs, Trainium, memory and network equipment create the first visible spending layer.
- 02Delivery and systems integration
Compute trays, racks, optics, switching and power modules must arrive as a functioning system.
- 03Campus construction and lease commencement
Land, buildings, finance leases and capacity contracts lock in supply across multiple quarters.
- 04Grid, power and cooling
Interconnection, substations, backup power and high-density thermal design determine whether equipment can run. The companies do not disclose a comparable liquid-cooling spend.
- 05Commissioning and revenue readiness
Installation, networking and software optimization move capacity into a sellable Azure, Google Cloud or AWS pool.
- 06Utilization and depreciation
Revenue must absorb equipment depreciation, energy and data-center operating costs. Utilization drives returns.
The beneficiaries arrive on different clocks
Silicon, servers, memory and networking
Microsoft's asset mix, Amazon's chip count and Meta's component-pricing impact place equipment at the front of the spending wave.
Campuses, electrical gear, cooling and construction
Land, buildings, substations, UPS, distribution, networking and thermal systems follow the project schedule. Supplier attribution needs named orders or campus evidence.
Billable capacity and cloud revenue
Revenue begins after commissioning. Microsoft's early delivery, Alphabet's unplaced assets and Amazon's future gigawatt commitments reveal the lag.
Supplier revenue will not move in lockstep with hyperscaler CapEx. Equipment vendors may recognize demand early. Electrical and construction work follows milestones. Data-center operators wait for delivery, lease commencement and billing. A single CapEx total cannot replace that timeline.
Five questions for the next calls
Mix
How are servers, campuses and finance leases changing? How much of the increase is component inflation?
Delivery
Are new capacity, dock-to-live, energization and commissioning cycles improving?
Constraint
Is cloud growth still limited by supply, or is customer absorption becoming the main variable?
P&L pressure
How fast are depreciation, energy and data-center operating costs growing against related revenue?
Conversion
When do backlog, capacity commitments and uncommenced leases turn into service and billing?
Microsoft guides Q1 Azure growth to roughly 45% in constant currency and CapEx above $50 billion. Alphabet, Meta and Amazon now provide a second check: Cloud and AWS accelerated, but all three still describe a capacity gap or a buildout extending into 2028. Microsoft FY2026 Q4 callMeta Q2 official transcriptAmazon Q2 results
The cycle now has two visible paths
Return improvement: capacity energizes faster, dock-to-live keeps falling, cloud demand absorbs the supply, and related revenue grows fast enough to cover depreciation, energy and operating costs. Microsoft, Google Cloud and AWS now offer early evidence of that conversion.
Return pressure: backlog remains strong but owned capacity arrives late; third-party capacity and component prices compress margins; depreciation and energy costs outrun supported revenue; free cash flow stays negative for longer. Alphabet's bridge capacity, Meta's multi-year build and Amazon's cash conversion are the gauges to keep checking.
The next version of this research will track CapEx, assets not yet in service, usable megawatts, commissioning dates, utilization and depreciation together. Capacity conversion and revenue absorption remain the tests for every conclusion.
IDC ATLAS VIEWAI CapEx starts with silicon and clears its final test as billable capacity. The return clock is set by how quickly campuses energize, commission and carry real workloads.