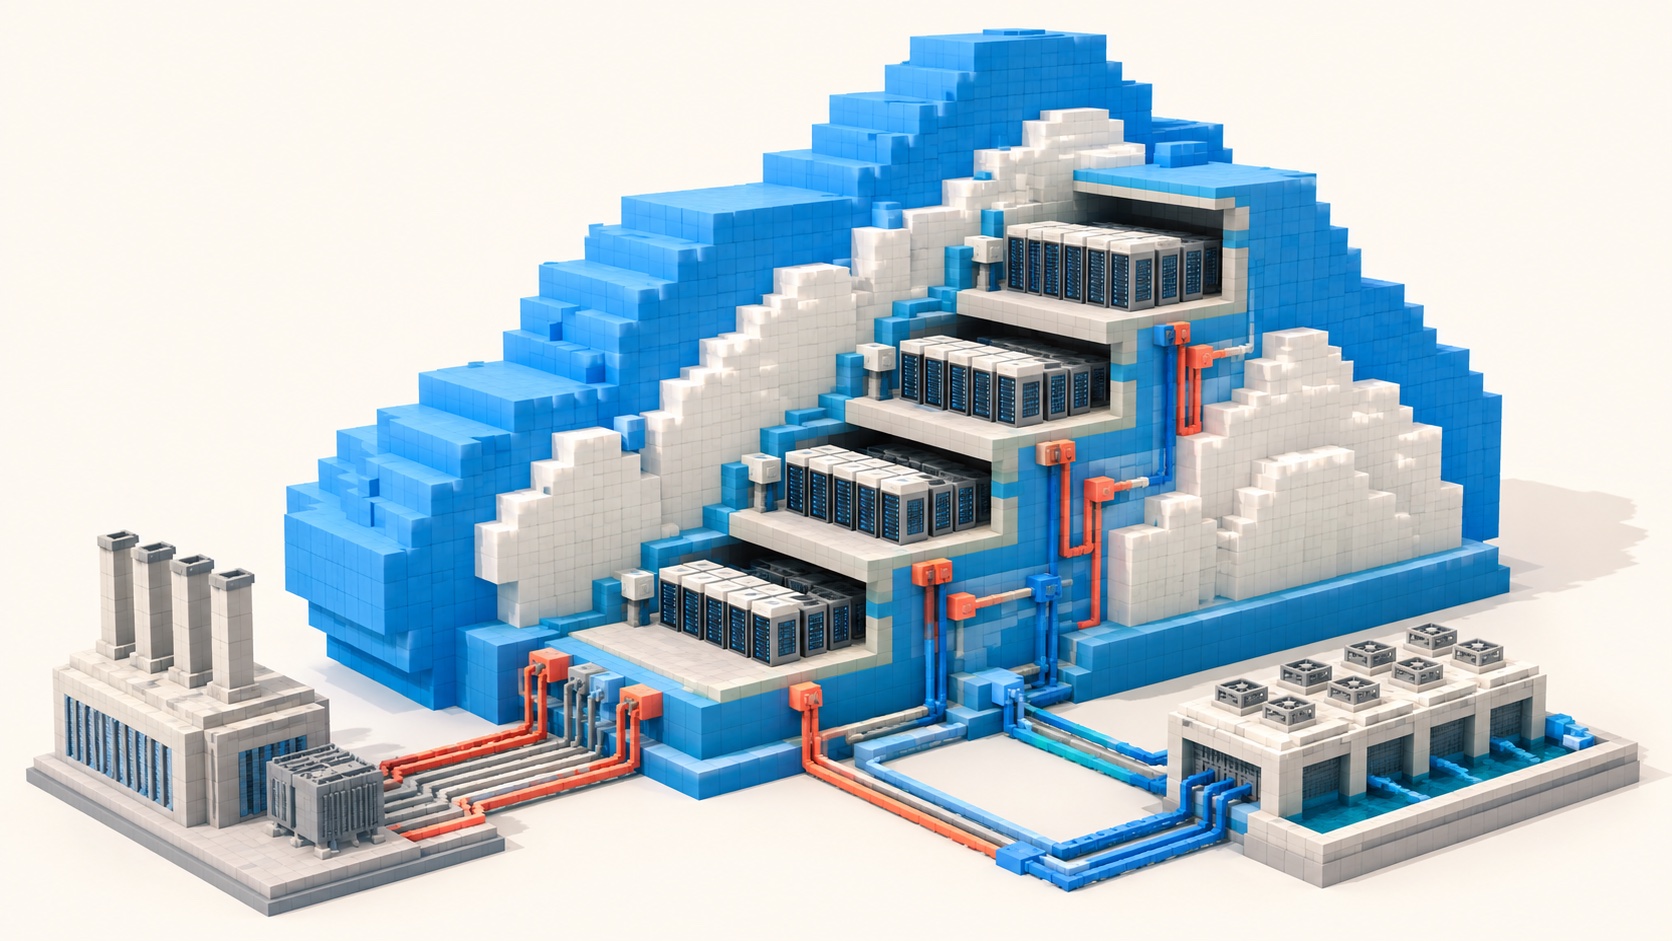
Microsoft closed fiscal 2026 with quarterly revenue of $90.0 billion, up 18%, while Azure and other cloud services grew 43%. Together, those figures turn an abstract CapEx debate into an operating question: how does infrastructure spending become cloud revenue?
The answer is spread across the release, prepared remarks and analyst Q&A. Microsoft added roughly one gigawatt of capacity in the quarter, accelerated the time from GPU delivery to live service, and improved throughput across chips, models and orchestration. Azure's acceleration therefore carries three inputs, each on a different clock.
Microsoft FY2026 Q4 resultsMicrosoft FY2026 Q4 earnings call
Separate the filing, management's view and the infrastructure inference
| Layer | Confirmed this quarter | Still unreported |
|---|---|---|
| Reported | $90.0B / +43%Quarterly revenue / Azure and other cloud services growth | Microsoft does not disclose quarterly Azure revenue, AI-workload revenue or return per unit of compute. |
| Management | Roughly 1GW added; 31 data centers opened; next-quarter CapEx above $50 billion. | A data-center count is not a capacity measure, and CapEx does not equal billable compute. |
| IDC Atlas view | Capacity, deployment speed and fleet efficiency are converting together; power and commissioning still constrain supply. | Project MW, vendor share, liquid-cooling spend and regional utilization remain undisclosed. |
Revenue, capital deployment and physical capacity follow different schedules. Equipment is ordered, sites are energized and commissioned, and customer usage reaches the income statement later. Compressing those stages into one headline overstates near-term certainty and understates the value of delivery execution.
Capacity, efficiency and cycle time all moved Azure
Capacity is the first engine. Microsoft said it added roughly 1GW in the quarter, brought 88 data centers online during the fiscal year and remains on track to roughly double overall capacity in two years. Supply is still constrained. In the Q&A, CFO Amy Hood said demand continues to exceed available supply and that spot asset pricing reflects the imbalance.
Efficiency is the second. Microsoft reported 30% better performance per dollar for Maia 200 against the latest-generation hardware in its fleet, and 40% better performance per watt for internal MAI models. These are company-reported, workload-specific comparisons. They still illustrate how revenue can expand within a fixed power envelope.
Cycle time is the third. GPU dock-to-live time in Microsoft's largest regions fell by nearly half during the fiscal year, while Copilot workload throughput increased fourfold from the start of the year. Bringing a GPU into service a week earlier has a direct economic value. Deployment has become a form of capacity.
The move from $190B to $175B is largely classification
Microsoft revised its calendar-2026 CapEx presentation from roughly $190 billion to roughly $175 billion while keeping the underlying investment outlook unchanged. The difference comes primarily from lease accounting. Estimated useful lives for data-center and office buildings were extended from 15 to 25 years, moving some future leases from finance to operating classification.
Headline CapEx is consequently becoming less comparable. A fuller monitor includes cash paid for property and equipment, finance leases, operating-lease payments and commitments, and energized usable capacity. This quarter, cash paid for property and equipment was $35.8 billion and finance leases were $5.6 billion.
The useful-life change also affects future depreciation. Management expects only a minimal fiscal-2027 operating-income benefit. Power, maintenance and lease cash obligations remain physical even when presentation changes.
Next quarter's capital must cross a longer delivery chain
Microsoft expects next-quarter CapEx above $50 billion and fiscal-2027 CapEx to grow. About two-thirds of quarterly CapEx went to short-lived CPUs and GPUs. That mix gives the company more procurement flexibility while increasing refresh, depreciation and reinvestment cadence.
Compute systems
GPUs, CPUs, servers, HBM, networking and rack-scale systems register orders first. Lead times determine when hardware enters deployment.
Power and cooling
Substations, backup power, distribution, liquid cooling and heat rejection determine the high-density capacity a campus can actually sell.
Commissioning and use
Energization, systems testing, migration and utilization complete the conversion. A finished shell is still separated from revenue by time.
Public projects make the physical chain visible. Microsoft detailed new capacity in Pecos in June and an expansion in Cheyenne in April. Land, community engagement, power and engineering schedules all sit inside the capacity plan.
Supply remains tight; “late binding” is the overbuild defense
Analysts asked whether Azure's acceleration could continue and how component inflation and overcapacity would be managed. Hood described a flexible stack: short-lived CPUs and GPUs represent the largest CapEx share and have shorter lead times, allowing procurement to slow if demand changes. Land and data-center construction are a smaller cost share, and expensive equipment can be bound later in a project.
That architecture reduces risk without erasing long-duration commitments. Land, interconnection, construction and leases become costly to reverse once underway. Microsoft's geographic spread, customer mix and first-party workloads create absorption options, but regional energization, hardware pricing and demand timing can still diverge.
Management said new contracts can reflect price increases while efficiency preserves customer value. The company can therefore offset infrastructure inflation through price, technical productivity or both. Cloud gross margin will show whether those tools are keeping pace.
Growth is visible; returns sit in margin, cash and conversion
Microsoft Cloud revenue reached $59.3 billion, up 27%. Microsoft Cloud gross margin was 65%, down year over year as Azure mix, AI-infrastructure investment and usage weighed on the measure, partly offset by efficiency. Operating cash flow was $55.4 billion and free cash flow $19.6 billion. The gap captures the cash intensity of the buildout.
Commercial remaining performance obligations reached $678 billion, up 84%, and rose 25% excluding OpenAI. Roughly 30% should be recognized in the next 12 months, while the longer-dated balance grew faster. RPO improves visibility but does not create immediately available revenue; delivery capacity, contract duration and customer deployment govern conversion.
Microsoft guides to roughly 45% constant-currency Azure growth next quarter. Four variables now need to move together: usable capacity, GPU deployment time, controlled cloud-margin pressure and RPO conversion. A break in any one of them would push capital intensity back to the center of the story.
Three developments would weaken the constructive reading
Capacity converts slowly
CapEx keeps rising while Azure growth fades, pointing to energization, deployment or utilization bottlenecks.
Cash returns keep compressing
Free cash flow persistently trails operating cash flow and cloud margin keeps falling, showing that efficiency has yet to cover infrastructure cost.
Backlog conversion slips
RPO growth fails to reach next-12-month revenue as contract duration, customer timing or supply constraints intervene.
IDC ATLAS VIEWMicrosoft is turning data-center expansion into a delivery system: build capacity, shorten activation, raise throughput per watt, then route contracted demand into billable service. The value of the next $50 billion will be proven by that system's conversion speed.